Another way to identify the domain and range of functions is by using graphs. Because the domain refers to the set of possible input values, the domain of a graph consists of all the input values shown on the x-axis. The range is the set of possible output values, which are shown on the y-axis. Keep in mind that if the graph continues beyond the portion of the graph we can see, the domain and range may be greater than the visible values. See Figure 6.
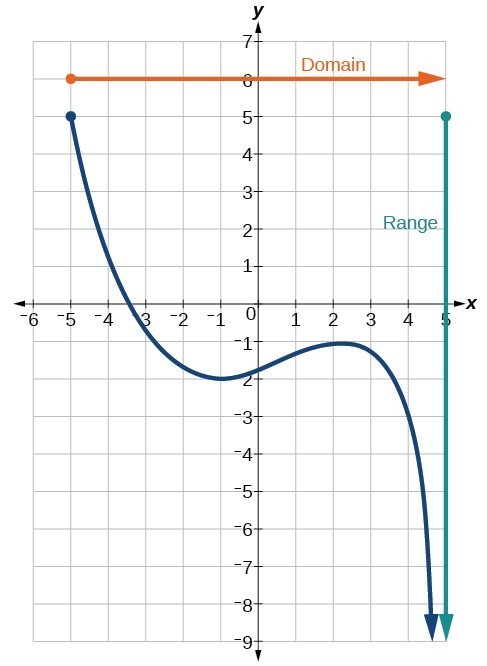 Figure 6
We can observe that the graph extends horizontally from
−5-5−5
to the right without bound, so the domain is
[−5,∞)\left[-5,\infty \right)[−5,∞)
. The vertical extent of the graph is all range values
555
and below, so the range is
(−∞,5]\left(\mathrm{-\infty },5\right](−∞,5]
. Note that the domain and range are always written from smaller to larger values, or from left to right for domain, and from the bottom of the graph to the top of the graph for range.
Find the domain and range of the function
fff
whose graph is shown in Figure 7.
![Graph of a function from (-3, 1].](https://assets.coursehero.com/study-guides/lumen/images/ivytech-collegealgebra/find-domain-and-range-from-graphs/CNX_Precalc_Figure_01_02_00722.jpg) Figure 7
Figure 7
We can observe that the horizontal extent of the graph is –3 to 1, so the domain of
fff
is
(−3,1]\left(-3,1\right](−3,1]
.
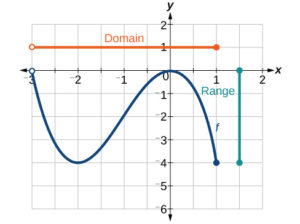 Figure 8
The vertical extent of the graph is 0 to –4, so the range is
[−4,0]\left[-4,0\right][−4,0]
.
Find the domain and range of the function
fff
whose graph is shown in Figure 9.
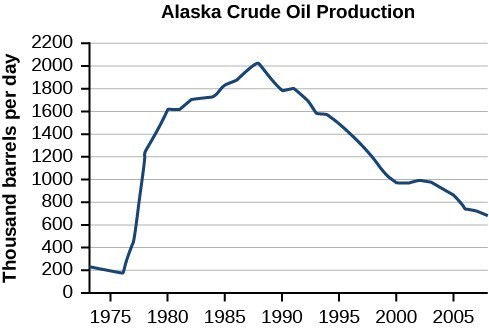 Figure 9. (credit: modification of work by the U.S. Energy Information Administration)
The input quantity along the horizontal axis is “years,” which we represent with the variable
ttt
for time. The output quantity is “thousands of barrels of oil per day,” which we represent with the variable
bbb
for barrels. The graph may continue to the left and right beyond what is viewed, but based on the portion of the graph that is visible, we can determine the domain as
1973≤t≤20081973\le t\le 20081973≤t≤2008
and the range as approximately
180≤b≤2010180\le b\le 2010180≤b≤2010
.
In interval notation, the domain is [1973, 2008], and the range is about [180, 2010]. For the domain and the range, we approximate the smallest and largest values since they do not fall exactly on the grid lines.
Given the graph in Figure 10, identify the domain and range using interval notation.
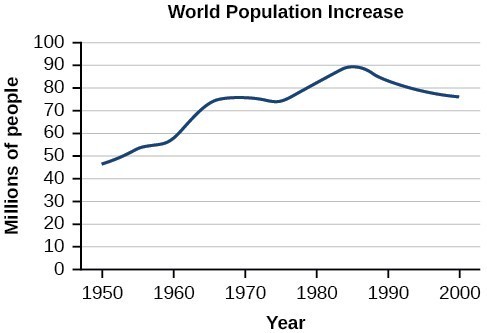 Figure 10
Solution
Can a function’s domain and range be the same?
Yes. For example, the domain and range of the cube root function are both the set of all real numbers.
Source: Ivytechcollege
Delivering a high-quality product at a reasonable price is not enough anymore.
That’s why we have developed 5 beneficial guarantees that will make your experience with our service enjoyable, easy, and safe.
You have to be 100% sure of the quality of your product to give a money-back guarantee. This describes us perfectly. Make sure that this guarantee is totally transparent.
Read moreEach paper is composed from scratch, according to your instructions. It is then checked by our plagiarism-detection software. There is no gap where plagiarism could squeeze in.
Read moreThanks to our free revisions, there is no way for you to be unsatisfied. We will work on your paper until you are completely happy with the result.
Read moreYour email is safe, as we store it according to international data protection rules. Your bank details are secure, as we use only reliable payment systems.
Read moreBy sending us your money, you buy the service we provide. Check out our terms and conditions if you prefer business talks to be laid out in official language.
Read more